24 de junio de 2011

Physical and political map of Europe.

Physical map of Europe:


Political map of Europe:

World climatological map.


On Earth distinguish five major climatic zones according to latitude: a hot zone, two temperate zones and two cold regions. Within these differentiate various types:

  • Warm climates are found in the intertropical zone.
     - Equatorial climate.
     - Tropical climate.
     - Desert climate.


  • Climates termperados-giving between the tropics and polar circles.
     - Mediterranean climate.
     - Atléntico or oceanic climate.
     - Continental climate.


  • Cold climates occur in the polar regions and high mountain areas.
     - Polar climate.
     - Climate of high mountains.

World water cycle.


The water is continually moving. Reçber What the name of the water cycle.
1.Evaporación: The heat causes the evaporation of surface water
2.Condesación: The vapor cools affects what gives rise to clouds.
3.Precipitación: Water from the clouds falls as snow, rain or hail.
4. Part of the water fall back to cycle.
5.Unha of the water goes to rivers and lakes seas or oceans.
6. The other part of the
water  is  absorbing of the land and  form aquifers.

Synoptic chart of Spanish political system.

Synoptic chart of teterritorial organization of state

Map of countries of the European Union.


Currently there are 49 independent states in Europe. Some states today have their origin in the very recent changes that have occurred since 1989, after the fall of communism in Eastern Europe.

Spanish population pyramide.


A population pyramid is a graph that representing the structure of the population into age groups and sex groups .
To make a population pyramid  need to know the number of its inhabitants, expressed in percentages.


Map of natural increase of world population.


Actualmente hay 49 estados independientes en Europa.
  - Diferencias:

  • Dependiendo de su longitud: la regla es la más grande de Rusia y la más pequeña de Andorra
  • Dependiendo de su situación: casi todas tienen vistas al mar
  • Dependiendo de su forma: Muchos están fragmentados
  • De acuerdo con su población: La más poblada es Rusia y el menos poblado es San Marino
  • De acuerdo a su riqueza: más ricos y más pobres son el alemán y Moldavia.

Population world map.


Causas de nacimiento:
-A medida que la economía
-Virilidad las mujeres casadas acess en el mercado laboral de la ingnorancia (pensamiento: Nuestros hijos van a morir Muy joven)
-Causas psicológicas
-Celivato
-De acuerdo con la política
-Puede ser prenatal (animarles a tener hijos) o anti-natalistas (Amimarles a no tener hijos).

Model of population cycle.


The model of demographic transition progresses in four stages:

-Old or preindustrial demographic regime: it is characterized by high mortality rates and birth rates.

-First transition: Keep the high birth rate, but mortality drops.

-Second transition: the birth rate begins to decline, but mortality is still down more slowly.

-Modern demographic regime: Mortality rates and very low birth.

Population density.


The density of population estimates the number of inhabitants between the surface of  the site. 

In general it is considered that an area is sparsely populated has a density of 10 inha./km2.  And that is a very populated area if the density exceeds 80 inha./km2.

Physical and political map of Asia.

Physical map of Asia:


Political map of Asian:


Physical and political map of America.

Political map of America:


Physical map of America:

Bar chart of income percapita of the countries E.U.


  This inequality is evident in the diagram. The first bar indicates the level of income per capita in 1820 and the second in 1998, according to estimates by Maddison. The numbers in brackets located above the second bar corresponds to the average annual growth rate of the region (between 1820 and 1998).

Highlights three main elements:

     * All regions were poor in 1820.
     * All regions have experienced some economic progress.
     * Today's rich regions experienced by far the greatest economic progress.

Gross domestic product of countires in the world.

Countries of the world sorted by their gross domestic product (GDP) to values ​​of purchasing power parity (PPP), the sum of all goods and services produced by a country in a year, in relation to purchasing power parity (PPP .) This is an economic indicator introduced in the early nineties by the International Monetary Fund in a realistic way to compare living standards across countries, taking into account the per capita gross domestic product in terms of cost of living in each country.

The PPP is one of the most appropriate for comparing living standards that the gross domestic product per capita, as it takes into account changes in prices. This indicator eliminates money illusion linked to changes in exchange rates, so that an appreciation or depreciation of a currency will not change the purchasing power parity of a country, since the inhabitants of this country receive their wages and make purchases in the same currency. Ie, allows the exchange rates between currencies are such as to allow a coin has the same purchasing power anywhere in the world.

Primary economic activity world map.

One of the main economic activities are:


Agriculture.
Livestock.
Fishing.
Logging.
Industry.
Crafts.
Gastronomy.

Types of farming.

In the Standard Grade Geography exam there are three types of farming you need to know about - arable, livestock and mixed.
  • Arable farms are ones where the main way of making money is by growing crops
  • Livestock farms are where animals are the important part of the farm
  • Mixed farms are where animals and crops are both important to the farmer 

Time line: Steges of joining the European Union.

http://www.timerime.com/es/linea_de_tiempo/511997/Etapas+de+ampliacin+de+la+Unin+Europea/

Map of the main international political organizations.

Bar chart of the number of internet users in the world.


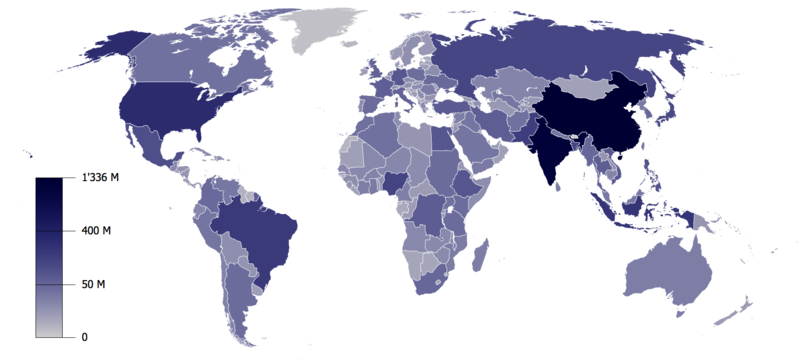
In the past five years, the global Internet population has grown from about 1 trillion to 1.6 trillion, and thisgrowth is not goingto stop in the short term. However, future growth is not
equally distributed throughout all regions of the planet.

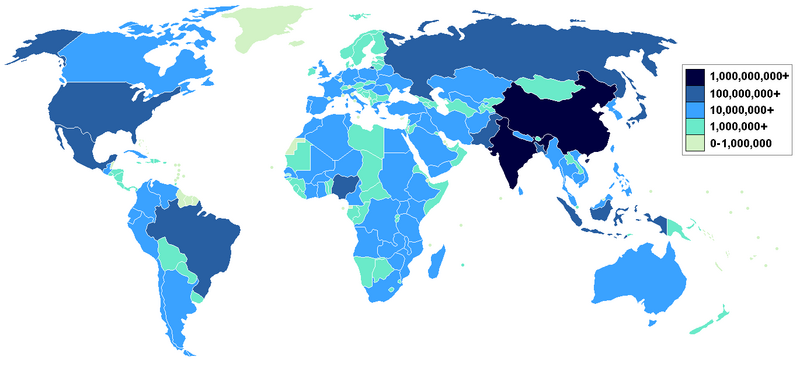
The latest report from Forrester ForecastView ensures that the Internet population will increase in all countriesthe world over the coming years, but emerging markets will grow at a faster pace. In 2014, one third ofInternet users come from Brazil, Russia,
 India or China.

Map of the world´s domestic product.

Countries of the world sorted by their gross domestic product (GDP) to values ​​of purchasing power parity (PPP), the sum of all goods and services produced by a country in a year, in relation to purchasing power parity (PPP .) This is an economic indicatorintroduced in the early nineties by the International Monetary Fund in a realistic way to compare living standards across countries, taking into account the per capita gross domestic product in terms of cost of living in each country.

Map of the main tourist areas.


According to the World Tourism Organization of the United Nations, tourism comprises the activities that make people (tourists) traveling to and staying in places outside their usual environment for a consecutive period of less than one year and more than one day for leisure, business or other reasons.

23 de junio de 2011

Map of world trade.


The trade is of growing importance in the global economic context, because the portion of production goes to foreign markets has been increasing steadily. In the past 50 years the physical volume of global production grew 8 times while the volume of exports increased 25 times (in value 150 times.) One consequence of this phenomenon is the increasing interdependence of economies and the need to incorporate an international perspective in household decisions. Hence the importance of highlighting some of the characteristics presented by global trade. 

Physical and political map of África.

Political map of Africa:
Physical map of África: